Knauss legislative fellowships in Congress help build careers — and they're fun and educational. See our video and fact sheet for details.
Modeling Menhaden: Applying Modern Statistics to Historical Data
You know the old adage “there are plenty of fish in the sea?” Well, what if that wasn’t the case? How would we even know this was becoming not the case before it was too late?
Quantitative fisheries scientists aim to answer these and many other fish-related questions. Such as: How many eggs are produced every year? Where do fish migrate each year or within a year? What is their maximum size or age? We want to answer these questions not just to have a better understanding of our environment and creatures of the Chesapeake Bay with whom we share this land, but also how best to fish or exploit natural resources without destroying the estuary we live near and love so dearly.
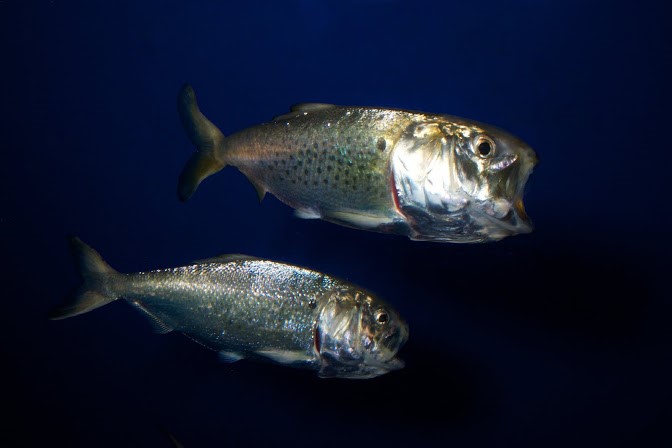
One economically and ecologically important, yet frequently overlooked, fish along the East coast is the Atlantic menhaden (Brevoortia tyrannus). Twelve to fifteen inches long, weighing in at less than 1 pound, you might think this creature is good for nothing more than a snack for larger, more popular fish like tuna and striped bass. But menhaden have been harvested for over 50 years to be processed into fish meal and fish oil, an important component of many essential byproducts like animal feed and fertilizer. So we need to track this population not only because they’re prey for the fish you see on the dinner table, but also because fishermen collect them in droves for use in these other important industries.
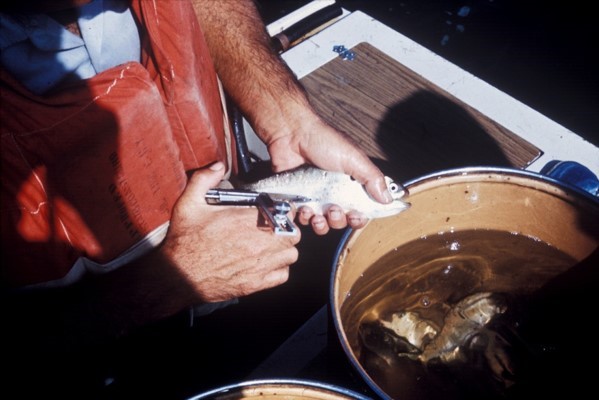 |
| A menhaden being injected with a ferromagnetic tag. Credit: NMFS Beaufort Lab |
When asked to estimate population abundance, above all, a quantitative fishery scientist hopes for a large, reliable data set. But what’s the old platitude? “Be careful what you wish for.” What my science fairy godmother dropped in my lap was millions of 50 year old data points. In the late 60s, researchers from NOAA’s Beaufort Lab in North Carolina organized this unprecedented survey. They injected fish with individualized magnetic tags, recorded information like length and age, and released them all along the Atlantic coast. When the fish were harvested by the thousands of tons, they were taken to processing plants that ground them into the fishmeal for which we use them. Huge magnets on the sides of the holding pens extracted any magnetic tags within this slurry of fish guts.
This information was collected into huge volumes of impermanent paper, damaged, forgotten, then recovered and converted into a digital format. Now it falls to our research group, members of the Wilberg and Miller labs at the Chesapeake Biological Laboratory, to take all this information — millions of data points on where and when these fish were released and recollected -- and put together some coherent picture of the menhaden population. Before I even tackled such a gigantic problem, I first had to learn a thing or two about the existing models and computer programs used to process this sort of data set.
| Logo for program MARK. Credit: Dr. Gary White |
One such program in popular use today is called “MARK” and was designed and has been consistently updated by Dr. Gary White, a professor at Colorado State University. Several times a year, he offers workshops structured to familiarize graduate students, professors, and professionals, such as governmental fisheries managers and non-profit analysts, on the techniques and nuances of this software. I attended one such conference at CSU the first week of June. Using real world examples of fish, fowl, and everything in between, we learned how to calculate a population’s size, its annual increase or decrease, and how much it migrates. We also learned how using different sampling methods affect the resulting data set based on how easily you can detect an individual within a population. The technique and model you use depends heavily on the type of data you have available. There are different considerations to be made if you are walking through the forest counting eagle nests versus putting a radio collars on seals. I learned about all of these and more and received valuable insight into how best to tackle my own unique data set on menhaden.
The difficulty with our particular data set is that we are trying to estimate migratory patterns but only have two pieces of information — where each menhaden was released and where it was caught. Those two events can sometimes be five years apart. It’s hard to tell from just those numbers alone if an individual fish swam up to Maine or spent all its time in the Florida Keys. My task will be to find ways to estimate this movement and make predictions for how the overall migration of the population will affect the future of the menhaden fishing industry. As a natural puzzle-lover, I’m ready for the challenge! I won’t be doing any netting myself, partially because the project does not call for it, but also because the menhaden industry has so drastically reduced in the past 40 years that we can no longer collect the same data we once could. However, I have assisted in ecological data collection before — monitoring cichlid mating behavior, quantifying cricket sperm, catching scorpions and mice in the Sonoran desert —without ever seeing what became of those pages and pages of numbers. I am incredibly excited to get the chance to statistically analyze the information myself.
Photo, top left: Adult menhaden. Credit: Brian Gratwicke.
Sign up to receive email alerts about new posts to the Fellowship Experiences blog
See all posts to the Fellowship Experiences blog
Program Announcements
Featured Fellow
Leone Yisrael is a cephalopod-loving scuba diver, cook, and loves to try new activities. She conducts genetic analysis and fieldwork at the Smithsonian Environmental Research Center through the Coastal Disease Ecology Lab.
FELLOWSHIP EXPERIENCES ARCHIVE
FELLOWSHIP EXPERIENCES TOPICS
Related Products

Managing the Chesapeake's Fisheries: A Work in Progress
This monograph is a major assessment of the state of key species in the Chesapeake Bay — the eastern oyster, blue crab, striped bass, and Atlantic menhaden — and of the prospects for shifting from single-species fisheries management to…

Chesapeake Quarterly Magazine
A Growing Industry: Advancing Oyster Aquaculture in Maryland