Knauss legislative fellowships in Congress help build careers — and they're fun and educational. See our video and fact sheet for details.
Mapping the New England Seamount Chain
Rachel Husted is an undergraduate serving as an intern on a NOAA scientific expedition currently underway in the North Atlantic. Maryland Sea Grant sponsored her to join this project. Here is her second dispatch.
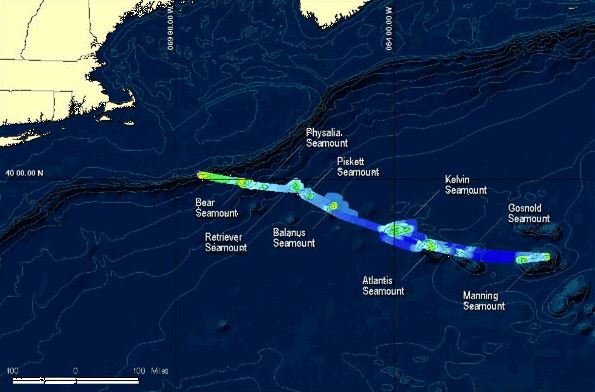
The Okeanos Explorer arrived at the New England Seamount Chain on Friday, August 15, and we will be mapping here until Wednesday, August 27. The submerged peaks span 700 miles and form the longest seamount chain in the North Atlantic. We are mapping just a subset of them on this expedition. So far, we have finished exploring the Gosnold and Sheldrake Seamounts and have moved on to the Gregg and San Pablo Seamounts. Previously, only basic satellite imagery existed of these mountains. This is the first time that they are being mapped in detail.
 |
|
New England Chain seamounts, including the Gosnold. Credit: NOAA
|
It is exciting to watch the data come in during our surveys, revealing the unique geological characteristics of each seamount. Updating our map with the new, clarified images is very satisfying. We have even “undiscovered” a feature that was previously thought to be a seamount. Technically, in order to qualify as a seamount, an underwater peak must rise over 3,280 feet (1,000 meters) above the surrounding seafloor. Our data showed that this feature didn’t measure up.
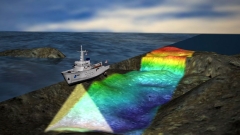
A lot goes into the seafloor mapping process. Sonar (which stands for sound navigation and ranging) is used to determine the depth of the water and the bathymetry (like topography, but underwater) of the ocean floor. The sonar also locates and identifies underwater objects, like the seamounts. The Okeanos Explorer uses a Kongsberg EM302 deep water multibeam sonar system. These kinds of systems send out beams of sound under the ship, and to its sides, along a swath of the ocean floor. With transducers installed on the ship’s hull, the sonar system transmits up to 288 beams, collects up to 864 depth measurements with a single ping, and automatically compensates for the movements of the ship.
 |
| A multibeam sonar image of Bear Seamount with Physalia Seamount in the background. Credit: NOAA |
The multibeam sonar can operate in depths from 10 to 7,000 meters. However, when the Okeanos traveled over the Mariana Trench in the Pacific Ocean (the deepest spot in the world’s oceans) a few years ago, it was able to detect the seafloor at 8,000 meters, leaving only the very deepest parts of the ocean inaccessible. The ship also carries an EK60 singlebeam sonar and a Knudsen sub-bottom profiler to provide additional information about the seafloor (e.g., layers of sediment or rock under the seafloor).
Every two to three hours, we launch an XBT (expendable bathythermograph) off the Okeanos' fantail to obtain a SVP (sound velocity profile) of the water column, which is then applied to the incoming line of multibeam sonar data to maintain its accuracy. XBTs are weighted probes that rapidly sink, constantly measuring the water temperature as they descend and transmitting that information back to the control room. Once the probe reaches a depth of 760 meters, we snap off the thin copper wire to which it is attached and leave the XBT to disintegrate in the sea. The speed at which sound waves travel varies in different water temperatures. We use XBTs to determine how the temperature varies with depth at our current location in order to calculate the speed of the pings sent out by the sonars and how fast they are reaching the underwater features, thereby revealing the seafloor bathymetry.
The Okeanos uses a survey method known as “mowing the lawn.” The expedition coordinator for the cruise draws a series of navigation lines over the areas of the ocean floor to be mapped. Using GPS, the coxswain then drives the boat exactly along these tracks. The lines are spaced out such that the edges of the data swaths captured by the sonar overlap. Ideally, one quarter to one half of each swath should overlap with its adjacent swath. Meanwhile, the ship’s speed is maintained at 8 to 9 knots, because going any faster can reduce data quality.
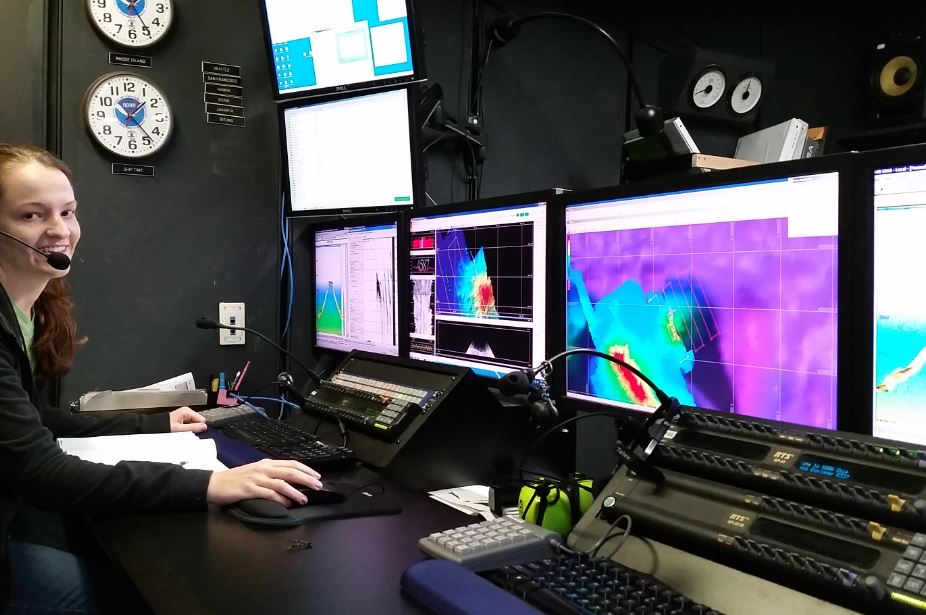
The watchstanders keep a ship’s log for reference concerning the data. We record when new lines are started and XBTs are conducted and other significant events such as bad weather or if equipment is malfunctioning. During acquisition, we monitor the quality of incoming sonar data in real time, 24 hours a day. The multibeam data are processed using Kongsberg’s SIS (Seafloor Information System) software. We then copy over the raw data to the CARIS (Computer Aided Resource Information System), where we clean and process it. Cleaning allows us to quality-check both the system and the data to ensure that NOAA will release the best products possible for public use.
From there, maps can be created using software programs such as Fledermaus and ArcGIS. At first, it was a lot to learn, but by now I have gotten comfortable with all of the procedures. It is helpful that most have been outlined in SOP (Standard Operating Procedure) documents that we can refer to while getting the hang of seafloor data processing and mapping.
As I begin my final week aboard the Okeanos Explorer, there is still a lot to be done. Fortunately, for the most part the weather has remained conducive to non-stop mapping (high seas distort the multibeam), and things are going according to plan. I continue to really enjoy my experience and look forward to putting together a map of all of the newly surveyed seamounts next week.
Read Rachel's first blog post about living and working on the Okeanos and her third blog post reflecting on the journey.
Photo, top: Visualization of a NOAA ship collecting multibeam bathymetry data. Credit: NOAA
See all posts to the Fellowship Experiences blog


