Knauss legislative fellowships in Congress help build careers — and they're fun and educational. See our video and fact sheet for details.
New Streams Map Promises to Aid Water Quality and Sustainable Development
December 16, 2013
Map Increases Detail, Accuracy for Maryland West of the Chesapeake Bay
University of Maryland researchers have built a novel, detailed map showing streams in Maryland not recorded on other maps. The new map, which identifies small and buried streams west of the Chesapeake Bay, provides a tool that promises to help efforts to protect streams from development and to improve the region’s water quality.
Besides providing more information to land-use planners and environmental scientists, the new map may also be of interest to homeowners with leaky basements. The researchers posted the stream map on a website that shows local streets superimposed. Zoom in at the block level, and you might notice a buried stream running near or under your house. Buried streams are ones covered over by human activities including construction of houses and roads.
The research was funded by Maryland Sea Grant and conducted by Andrew Elmore and colleagues at the Appalachian Laboratory, in Frostburg, part of the University of Maryland Center for Environmental Science. He calls the result “the most ambitious attempt yet to model stream networks over a large region."
 |
| A new map created with funding from Maryland Sea Grant shows previously unrecorded Maryland streams (blue), adding detail to previously mapped streams (black.) Credit: Appalachian Laboratory |
Streams, especially small ones, can play an important role in improving water quality, a key problem in the Chesapeake region. A healthy stream ecosystem can remove excess nutrients, sediment, and other contaminants from water before they reach the Bay. That makes the new map “an important tool for improving our understanding of how to keep the Bay clean,” says Christine Conn, director of the Maryland Department of Natural Resources’ integrated policy and review unit. “If we don’t know where these streams are, we have difficulty managing the resource, both for conservation and restoration.”
Elmore’s map identifies a network of stream channels across Maryland denser than those shown on maps based on a widely used, nationwide database about surface waters, the National Hydrography Dataset (NHD.) In some portions of Maryland, the “stream density” in Elmore’s map (measured as kilometers of stream length per square kilometer) is 2.5 times that shown in maps of the same area based on NHD data. Elmore’s map filled in blank spots on the NHD with many new, thin squiggly lines representing where streams flow now or once flowed before they were buried.
Forest Streams As a Model
The differences between the two maps reflect several differences in how they were created. The U.S. Geological Survey created the NHD in the 1990s using aerial photographs, but some smaller streams may not have shown up, Elmore notes. What’s more, for the purpose of creating stream maps, the Geological Survey defines a stream as a body of flowing water that contains water most of the time. However, some of the smaller streams shown on Elmore’s map may flow only intermittently, for example, during spring rains. Many other small stream channels in cities like Baltimore and Washington, D.C. have been buried. (Some of these no longer flow at all; others may still flow underground through culverts.)
When Elmore and his colleagues began creating their map, they started with a fundamental question: what would Maryland’s network of streams look like if all of the state west of the Bay resembled the state’s remaining forests? The forests are relatively untouched by the effects of development, and so the stream network there can be considered representative of that existing in a pristine, natural landscape (although in reality, even the forests have been altered somewhat by human activities.)
The scientists constructed a computer model predicting where streams flow today in those forests, then used the same model to predict the location of stream channels in non-forested areas, including suburban and urban locales where houses and roads were constructed.
To create the model, Elmore and his colleagues started with the known locations of 253 stream headwater zones in upland, forested areas of Maryland. The scientists combined this information with other, statewide data about terrain slope and soil characteristics that can indicate the presence of streams. This information allowed the model to predict the location and course of streams flowing downhill from the upland, forested areas. The scientists then extended the model to predict where streams would probably flow today across all of Maryland west of the Bay, including in non-forested areas.
 |
|
Andrew Elmore. Credit: Appalachian Laboratory |
“The map is really a map of what the stream network would look like if the entire landscape had the same land use, and land use history, as our forests,” Elmore says.
The map covers a large area with diverse terrain, including the Potomac River watershed and five smaller ones in Maryland – more than 23,000 square miles in all.
The model offers high resolution – it divides this landscape into many thousands of squares each measuring only 10 meters per side. The scientists checked the model’s accuracy based on field data about the presence or absence of streams in more than 10,000 locations in Maryland. Of the model’s predicted stream locations, 84 percent were correct, higher than the NHD’s accuracy rate of 55 percent.
Uses of the New Map
Elmore says that the map could help improve a variety of projects underway around Maryland to preserve and restore streams and to improve water quality.
“If you were going to do any sort of green infrastructure project that involved water – an artificial wetland or some sort of retention pond -- this map would help you decide where to put that,” he says. “If you’re looking at a broad region, you don’t want to cluster all your restoration projects in one area, you want to distribute them on the landscape. … Having data on resources like this allows you to make those decisions more accurately with better informed data.”
Officials in several Maryland counties have contacted Elmore about using the map to help them comply with the new rules called TMDLs (Total Maximum Daily Loads) intended to improve the Bay's water quality The map could help inform where to plant stream-side buffers of trees to help remove nutrients and sediments from run-off. The map “opens up the amount of land where we could potentially plant buffers to meet those TMDLs,” he says.
Conn of the Department of Natural Resources says that her agency may incorporate Elmore’s data into its next update of the maps used to create its GreenPrint tool, a statewide map that identifies lands and watersheds as priorities for conservation because of their high ecological value.
And, Elmore jokes, “If you’re in the business of water-proofing people’s basements, I can give you a great map of who to send fliers to.”
Eventually, the national NHD dataset will evolve to include a higher level of detail similar to that in Elmore’s map, says Jeffrey Simley, a cartographer at the U.S. Geological Survey. “We live in a world of change, and as technology improves, scientists will demand more out of a dataset like the NHD,” he wrote in an email. “The only thing holding us back is the lack of funding for such development and the need for such detail in many parts of the country.”
Elmore and his colleagues published a description of the model earlier this year in the journal PLoS One.
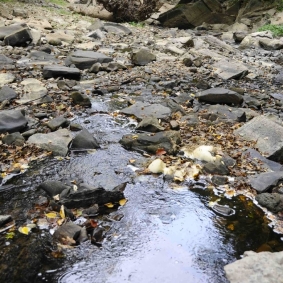
Stream photo top left by Jack Greer
Learn More
- Maryland Sea Grant Extension specialists can help communities and homeowners plan watershed restoration projects and manage stormwater. Check out our resources.
- Related Maryland Sea Grant news article: Accurate Maps Needed to Protect Streams in the Headwaters of the Chesapeake
Program Announcements
CONTACT THE COMMUNICATIONS STAFF
Please share your ideas for articles, blog posts, and coverage. See our contact information and more about what we do.
News and Blogs


Related Products

Chesapeake Environmentalism: Rethinking Culture to Strengthen Restoration and Resource Management
In the first issue of this monograph series, Chesapeake Perspectives, cultural anthropologist Dr. Michael Paolisso provides his perspectives on environmentalism and the Chesapeake. Building on his studies of diverse communities—from watermen to…