Comparing Tree Rings and Precipitation

Share:

Instructional Level: Middle School - Earth Science

Lesson Plan: Dendroclimatology

Driving Question(s):

How can the subject of dendroclimatology be used to reveal historical changes in a climate?

LESSON PLAN STANDARDS:

NGSS: MS-LS1-5
MD E-Lit: 3A 3B

Exploration

This activity provides students with the opportunity to compare data collected from their own dendrochronology measurements in the Cross Section Analysis activity along with precipitation data from NOAA to think about how they may be correlated.  Students will use Excel to graph the precipitation and tree ring data to prepare for analysis in the summative assessment.

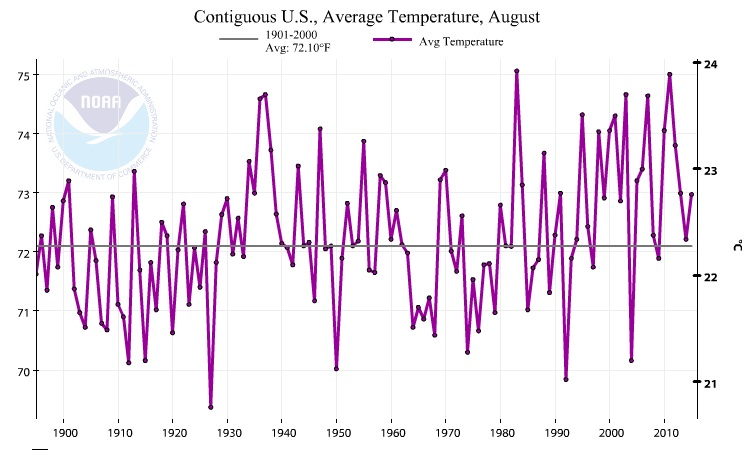
Image:  Graph generated from the NOAA Climate at a Glance website.

Objectives

Students will:

  1. Be able to appropriately graph data related to dendrochonology measurements from the Cross Section Analysis activity and precipitation data from the NOAA Climate at a Glance website.
  2. Make observations of NOAA data and tree-ring data and describe/illustrate any correlation.

Lesson Materials

Computers with Internet access and Excel.

NOAA Climate at a Glance, http://www.ncdc.noaa.gov/cag/

Precipitation Data Collection Instruction sheet

Combining and Graphing the Data Instructions sheet

Excel Sample Data

Graphing Rubric

Procedures

Explore:

  1. Open Excel on the computers.
  2. Use the Precipitation Data Collection Instructions sheet to download annual precipitation data from Baltimore, MD, using the NOAA Climate at a Glance website
  3. Use the Combining and Graphing the Data Instructions sheet to combine and graph tree ring data and precipitation data.  For an example of how the data should appear, see Excel Sample Data.

Explain:

Using the graph answer the following question:

Does there appear to be a correlation between the width of the tree ring and the amount of annual precipitation?  

Evaluate:

The graph can be graded as a formative or summative assessment. Use the Graphing Rubric to evaluate the student work.


Standards

Measuring and graphing tree ring data

Explaining correlation between NOAA precipitation data and tree ring measurements

References

NOAA Climate at a Glance, http://www.ncdc.noaa.gov/cag/

NGSS Common Core Connections:

MS-LS1-5

Standards: MS. Growth, Development, and Reproduction of Organisms

Performance Expectations: Construct a scientific explanation based on evidence for how environmental and genetic factors influence the growth of organisms.

Dimension
Name and NGSS code/citation
Specific Connections to Classroom Activity
Science & Engineering Practices

Planning and carrying out investigations

Obtaining, Evaluating and communicating information

Measuring and graphing tree ring data

Explaining correlation between NOAA precipitation data and tree ring measurements

Crosscutting Concepts

Patterns, Cause & Effect, Stability and Change

Scale, Proportion and Quantity

Measuring and graphing tree ring data

Explaining correlation between NOAA precipitation data and tree ring measurements

Disciplinary Core Ideas

MS-LS1.B Growth and Development of Organisms

MS-LS1.B Genetic factors as well as local conditions affect the growth of the adult plant

Inferring effect of varying amounts of water on tree growth

Common Core State Standards (CCSS):

6.SF.B.4

Summarize numerical data sets in relation to their context.

WHST.6-8.9

Draw evidence from informational texts to support analysis, reflection, and research.

Environmental Literacy Goals (E-Lit):

3A

Analyze and explain the movement of matter and energy through interactions of earth systems.

3B

Analyze and explain the influence of this movement on...the distribution of life.

The Blue Crab: Callinectes Sapidus

An essential resource for researchers, students, and managers.  Get your copy today!

Subscribe to Our Newsletter